
File:Papers and patents are using narrower portions of existing knowledge.png

原始文件 (1,632 × 1,105像素,文件大小:306 KB,MIME类型:image/png)
摘要
| 描述 |
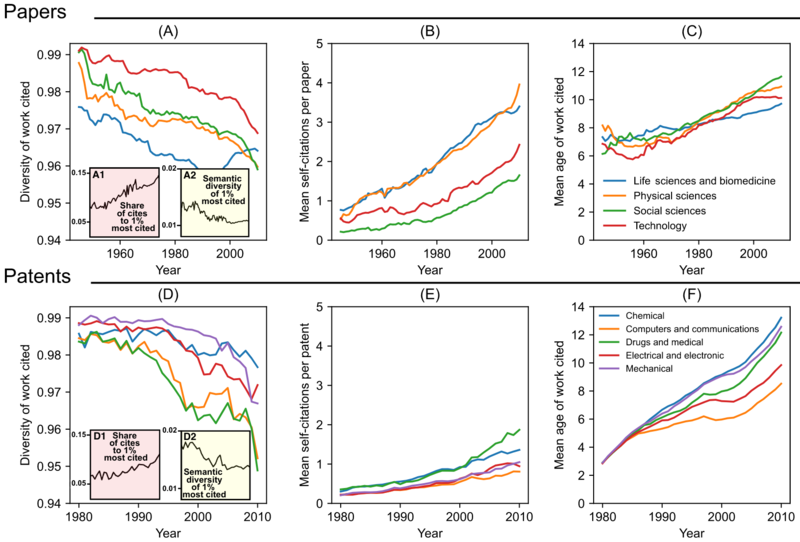
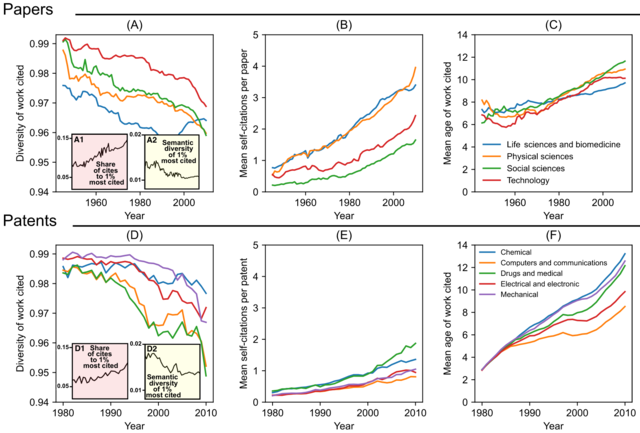
English: "This figure shows changes in the level of diversity of existing scientific and
technological knowledge use in papers (A, B, and C) and patents (D, E, and F) based on following measures: diversity of work cited (A and D), mean number of self-citations (B and E), and mean age of cited work (C and F). The inset plots of A and D show changes in the share of citations to the top 1% most highly cited papers (A1 and D1) and in the semantic diversity of the top 1% most cited over time (A2 and D2). Values of both measures are computed within field and year, and are subsequently averaged across fields for plotting. Semantic diversity is based on paper and patent titles; values correspond to the ratio of the standard deviation to the mean pairwise cosine similarity (i.e., the coefficient of variation) among the titles of the 1% most cited papers and patents by field and year. To enable semantic comparisons, titles were vectorized using pretrained word embeddings. For papers, lines are shown for each WoS research area; for patents, lines are shown for each NBER technology category. In subsequent regression analyses using these measures, we find that using less diverse work, more of one’s own work, and older work is associated with less disruptive papers and patents (see Methods, Extended Data Table 2)" |
| 日期 | |
| 来源 | https://arxiv.org/abs/2106.11184 |
| 作者 | Authors of the study: Michael Park, Erin Leahey, Russell Funk |
许可协议
文件历史
点击某个日期/时间查看对应时刻的文件。
| 日期/时间 | 缩略图 | 大小 | 用户 | 备注 | |
|---|---|---|---|---|---|
| 当前 | 2023年2月22日 (三) 22:45 | | 1,632 × 1,105(306 KB) | Prototyperspective | rotated (previous file can get deleted) |
| 2023年2月22日 (三) 22:39 |  | 1,105 × 1,632(347 KB) | Prototyperspective | Uploaded a work by Authors of the study: Michael Park, Erin Leahey, Russell Funk from https://arxiv.org/abs/2106.11184 with UploadWizard |
文件用途
没有页面使用本文件。
全域文件用途
以下其他wiki使用此文件:
- en.wikipedia.org上的用途